Japan Boasts Largest Commercial Fleet in the World

China and Greece Round Out Top Three Shipowning Nations
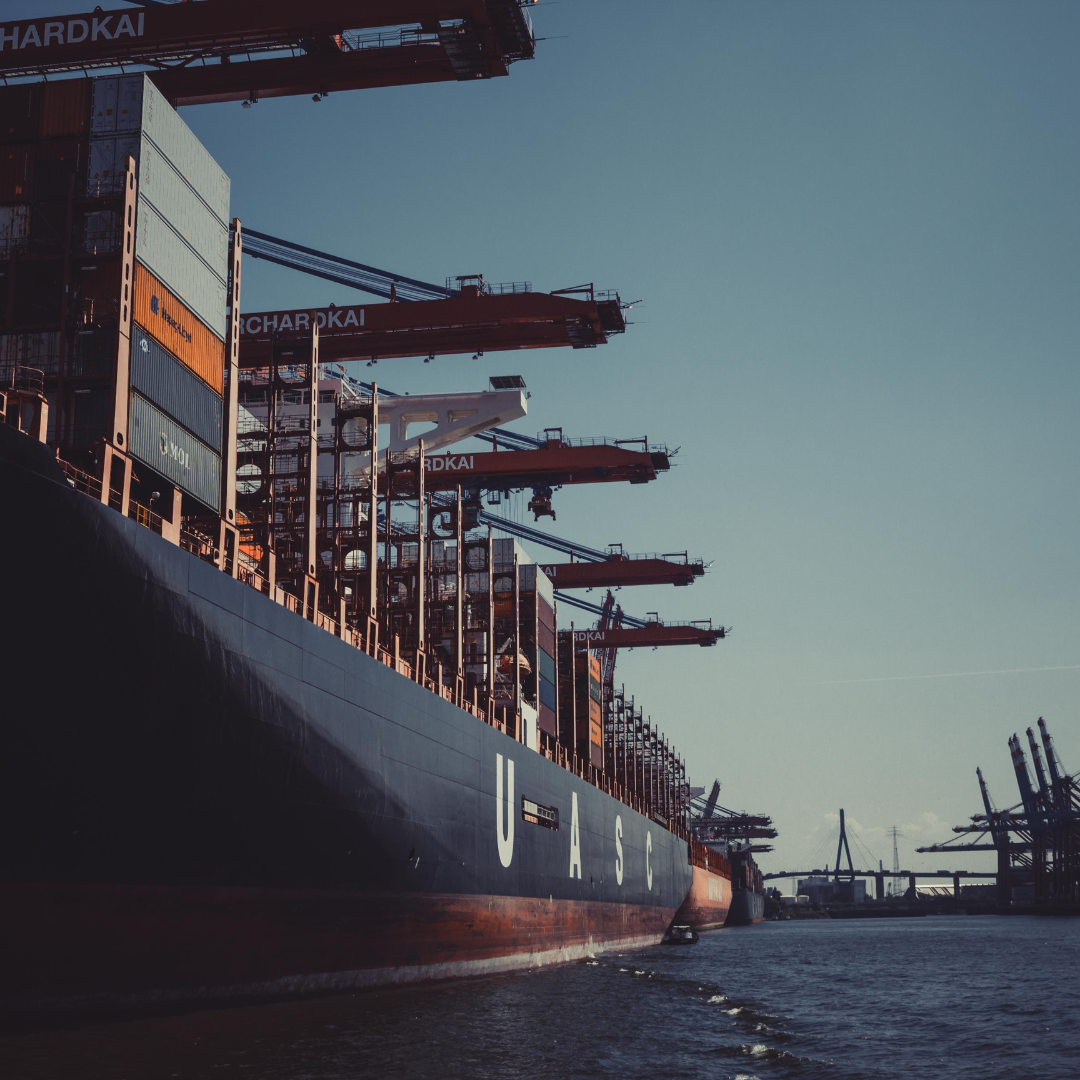
Countries have been re-investing windfall profits into bulking up the size of their commercial fleets. While many major shippers chose to invest in expanding their airline fleets, the main focus has been on maintaining and growing seaworthy vessels—from containerships to cruise ships and everything in between.
With data released by Vessels Value last month, we can take a closer look at which countries are emphasizing investment in their commercial fleets.
Japan Sees 5% Increase in Commercial Fleet Value
The east continues to vie for supremacy on the high seas—metaphorically speaking. Japan’s commercial fleet grew by 5% since the last report in November 2022. It needed every inch of that growth to outpace China, whose commercial fleet is valued at $204 billion. Japan claims the largest fleet of vehicle carriers, by value and size, with 334 vessels valued at $22.9 billion.
China slightly edges out Japan in bulker, tanker and container value, but is vastly outperformed in LNG and LPG value. It is possible that Japan could surpass the size of China’s tanker fleet in the near future. The Land of the Rising Sun have added nearly 100 vessels to their tanker fleet, in total value of a 15% increase in total value.
The only other areas where Japan fails to lead the pack are in renewable energy (United Kingdom tops the category with $446 million) and cruising (United States is miles ahead of the rest of the world with $49.2 billion). Nearly half of the total United States fleet value comes from the cruising sector, thanks to Carnival and Royal Caribbean—both headquartered in Miami.


Greece Tankers Hold Highest Value in Over a Decade
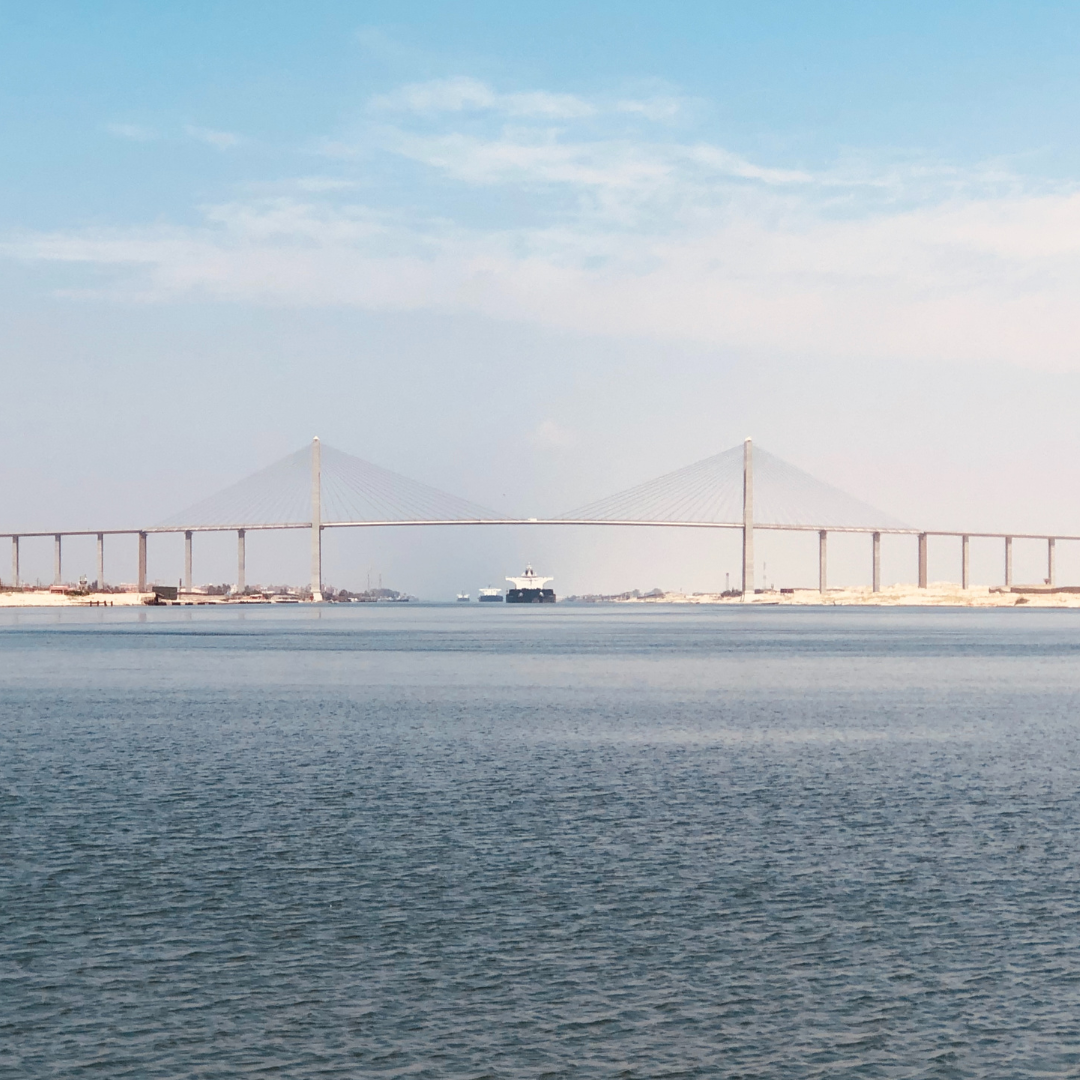
The ongoing conflicts in Eastern Europe and the Middle East continue to heavily impact the global shipping industry. Russian sanctions have raised the value of tankers, as exporters and importers look to deliver gas and energy to Europe. Vessel Values cites this as the reason Tanker values are rising to “the highest levels since 2010…values of 15 year-old Suezmaxes of 160,000 DWT are up 20% from the same period last year.”
Additionally, Yemeni Houthi attacks in the Red Sea have boosted short term earnings for shippers. Through this upheaval, Greece has stayed strong as the third-ranked country by total vessels and value. With 143 liquefied natural gas (LNG) vessels, Greece owns the second largest fleet, only lagging behind Japan (202 ships).
Hong Kong Joins the Top 10
The bottom end of the list has seen the most shuffling in recent history. The gap between the 10th to the 6th largest fleet is under $25 billion, while the gap between the 5th and the 1st is $120 billion. Norway and the United Kingdom leapfrogged Germany, which fell to 9th place on the list. Germany is putting more investment in LNG ships, nearly doubling the value of their fleet from $625 million to $1 billion.
Hong Kong made its first appearance amongst the big boys thanks in large part to their investment in bulkers. Similar to the United States’ value being dominated by cruising, 29% of Hong Kong’s value comes from a sole sector. In this case, the bulking sector value has grown 30% year-over-year.

SiShips Gives You the Advantage
SiShips combines expertise with state of the art software to bring you high quality domestic and international shipping solutions. We put the shipper in control, offering efficient and cost effective ways to ship your product.
To learn more about managed transportation with SiShips or to view a demo of our software, contact us today.